Before diving into how we measure customer loyalty, I want to explain the inspiration for this post.
Let’s play a quick game of word association. (Don’t fret, there’s no wrong answer).
When I say “marketing metric,” what’s the first thing that pops into your head?
Is it something around sessions, MQL’s, or landing page conversions?
Yes? Well, me too.
And that’s a problem – because those focus solely on customer acquisition.
As marketers, we live in a “top of funnel” world, always seeking more instead of capitalizing on the audience we already have. Why aren’t we more focused on brand loyalty and customer retention? My guess is that since our livelihood is typically evaluated by short-term growth KPIs, we are constantly on the look-out for shiny, new channels and tactics to give us an incremental edge over competitors. As a result, we lose sight of the overarching, long-term business goal: to become more profitable.
Customer Acquisition vs Customer Retention
In Business 101, we learned that it’s far more valuable to retain a customer than acquire a new one. In fact, a recent study done by the Harvard Business Review found that it can be anywhere from five to 25 times more profitable. Disclaimer – I don’t have an MBA, but I hear that’s pretty good.
My point is, if customer retention is the bee’s knees, why obsess over the reach of a one-off awareness campaign with no clear, tangible result? What if we ditched the billboard budget, and invested heavily in cultivating an enamored customer-base that really digs your brand?
RELATED READING:
Content Marketing Workflow: An Agile Approach For Consistent Results
When we shift our focus from customer acquisition to retention, the potential is endless. (These companies have done exactly that, and they’re killing it). End of rant. Let’s dive in.
Leverage Existing Data to Measure Customer Loyalty
If we’re going to allocate more resources to building a loyal audience, we first need to determine how we’ll consistently measure performance over time. To quote the late Peter Drucker, “What gets measured gets managed.”
There are two ways to measure audience loyalty
- By implementing primary research via surveys and interviews
- By mining existing data for insights
A quick Google search landed me with 4.5 million results for creating customer-focused email surveys. This covered everything from executing general brand awareness surveys to gauging your Net Promoter Score.
I’m not going to reinvent the wheel – these are excellent pieces of content. If you haven’t considered asking your customers directly what they think of your brand, I highly recommend you do so.
But what I couldn’t find were resources that articulate how to leverage the analytics we already have from existing content to find tasty insights.
Though there’s no one-size-fits-all approach to quantify brand loyalty, the ideas outlined below are applicable to anyone with Google Analytics tracking and a spritely, can-do attitude. I chose to focus exclusively on Google Analytics, because the last thing you need is another tool to learn and configure.
For the scope of this blog, we’ll be exploring loyalty metrics derived from content, not eCommerce. Every report that I walk through below should be fairly easy to implement, even with only a baseline knowledge of Google Analytics.
RELATED READING:
Experiential Marketing: An Authentic Way to Build Your Brand Presence
Determine Your Needs Before Exploring Analytics
One piece of advice before scouring through your analytics like a fearless honey badger – determine what information you need in order to make intelligent decisions, then write it down.
I’m serious – take the 60 seconds to write it down. This might save you hours in the long run. In the complex world of analytics, it’s easy to get overwhelmed by the seemingly infinite stream of information. This is something I like to call “paralysis by analysis.”
Don’t forget why we look at analytics in the first place: to make intelligent decisions that drive a positive change.
So, in our context of measuring brand loyalty, we’re looking for data that helps paint a story around:
- How often people are coming back to our site for more
- What portion of our audience is actively engaging with our content (I’m making the assumption that consistent engagement leads to long-term loyalty)
Thanks for sticking with me thus far. And now for the goods: actionable reports to measure your customer loyalty. (And a few bonus tips to improve it).
Analyze your audience with “Returning Visitor Rate" (RVR)
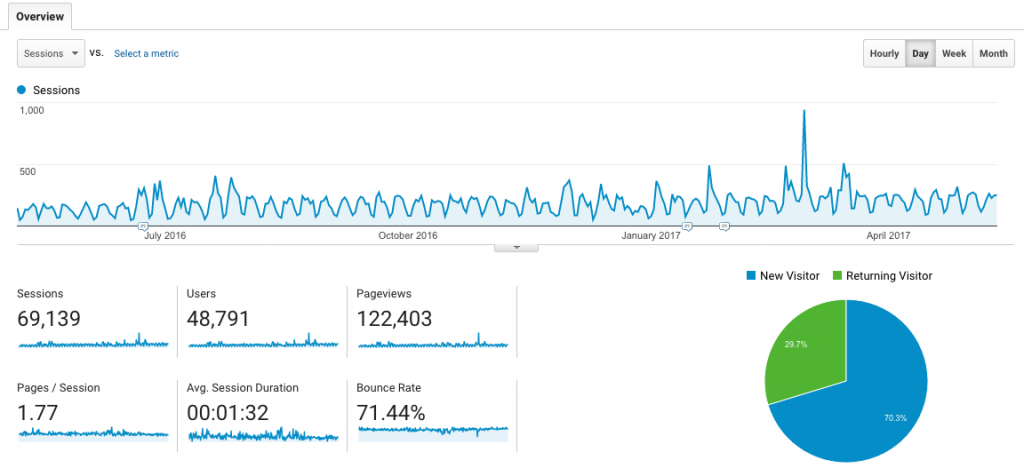
Why it’s important: These are the people who have deemed you worthy of a return visit. While there are no established industry benchmarks around RVR, 30% is generally considered decent, 40% is stellar, and anything above 50% is an indicator that it’s time to grow your audience base with net new traffic.
How to measure it: There are a few ways to measure this, the obvious one being the breakdown found in the Audience > Overview tab. In the corner we see our rate of returning visitors.
Don’t freak out, there’s still hope.
This report can unveil insightful nuggets when comparing channels or platforms by creating audience segments. (If you don’t know how to create audience segments, check out this resource from Google.)
In this example, we compare the RVR of organic and social traffic, which helps to show how distinct channels impact our audience’s buyer journey.
Segmenting our organic and social traffic ultimately unveiled the behavioral differences between our two sources. We can infer a few things here:
- We need to explore tactics to improve our blog quality in order to keep organic traffic coming back more consistently (one of those tactics being the creation of more in-depth, comprehensive posts like this!).
- Our social manager is killing it. When it comes to channels that engage our existing audience, our social platforms are among our top performers. Such a high RVR might even lead us to allocate more resources for the social budget to build a larger net new following.
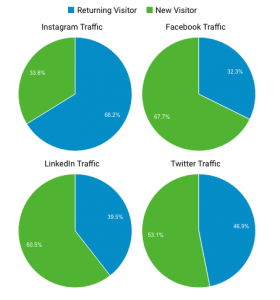
Another useful way to review RVR is to break things down by platform. Let’s continue our above example by comparing some of our core social accounts.
Granted we’re not taking overall traffic volume into account, these ratios are solid performance indicators. We can compare these against our goals and adjust our social promotion strategy accordingly.
RELATED READING:
3 Simple Copywriting Tips to Enhance Your Content Messaging Today
Measure Behavior with “Frequency and Recency”
Why it’s important: This might sound fairly self-explanatory, but stick with me. I’ve got a few tricks up my sleeve. Sure, it’s great to track how often your audience is returning, but it’s tough to derive any insights from data this broad.
This report gets far more interesting when we measure for success at the campaign level. This is huge, people! Instead of measuring campaigns by overall goal conversions, we can monitor our traffic’s activity after the conversion transpired, which is immensely more valuable. Now we can answer the elusive question of, “Did our target audience download our eBook and ride off into the sunset, or is our content bringing them back and establishing an ongoing relationship?”
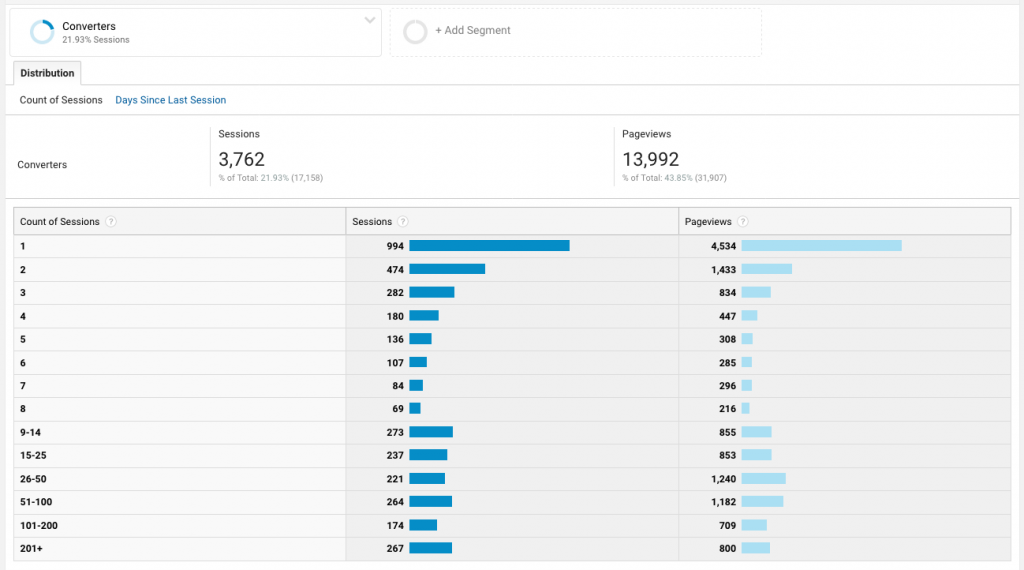
How to measure Frequency and Recency:
First, create a segment from each specific campaign you want to measure. (Note: to measure a unique campaign, you must use custom URLs from Google’s Campaign URL Builder).
Next, in the audience tab, navigate to Audience > Behavior > Frequency and Recency. There are two ways to view the data here – by “Count of Sessions”, or the “Days Since Last Session.” Typically, I prefer the former as it offers more insight into the volume of returning visitors, but you should go with the one that better aligns with your reporting needs.
How can you drive more returning visitors?
There’s a plethora of tactics that can help pull visitors back to your site – paid social, retargeting, etc. Personally, email is my all-time favorite channel. It may not be sexy, but it’s the OG of ROI. Once you’ve secured an email address, it’s essentially free to pull customers back to your site. This will bring your cost per conversion down over time and boost total ROI. CMOs dig that. To help you develop a killer email marketing strategy, check out this HubSpot resource.
Gauge Visitor Interest with “Returning User Engagement”
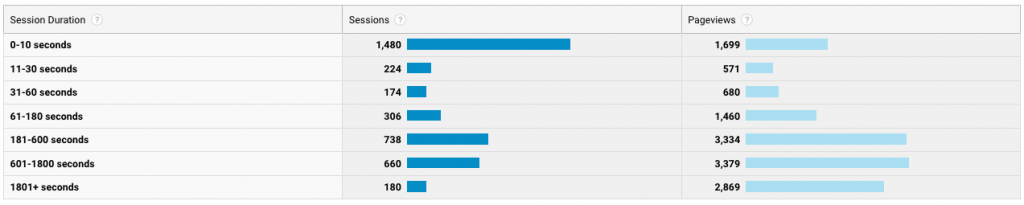
Why it’s important: Session duration is a solid “engagement” metric and provides more granular insights into your audience’s tendencies than the somewhat vague “Avg. Session Duration.”
Now you have visibility into how long visitors tend to stick around. Do they enjoy consuming your content? Or do they take one look and return from whence they came?
How to measure Returning User Engagement:
For a general pulse on how engaged your returning users are, begin by creating a returning visitor segment.
In the audience tab, navigate to Audience > Behavior > Engagement. In this example, we can see that we have a solid volume of returning users that spend time consuming our content. There won’t be many “ah-ha!” moments here, but this report gives you a valuable KPI to measure over time for content marketers and e-commerce sites alike. Note: In our case, users spending tons of time on our site is typically a great thing, but that’s not the case for everyone. Quick visits may be a good thing if the purpose of your page is to answer a question or solve a problem (i.e. movie times, weather, etc.).
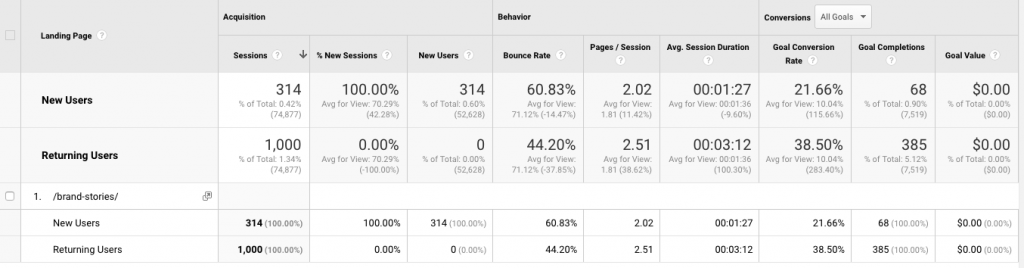
While we’re on the topic of content marketing, let’s explore returning user engagement in another way – By reviewing the user data on our core pages. (This might be your main blog page, FAQ page, or content hub). To get there, navigate to Behavior > Site Content > All Pages. In this example, we’ll review our Brand Stories page, which we’ve identified as a critical part of our buyer’s journey.
There a few things that I pay close attention to here: Avg. Time on Page, Bounce Rate, Pages/Session, Avg. Session Duration, and Goal Conversion Rate. (If you have a monetary value assigned to your goals, then you’ll definitely want to pay close attention to that one!).
Here we can see that our content efforts seem to be paying off. Our audience is coming back for more, staying actively engaged, and their bounce rate is relatively low. Not bad.
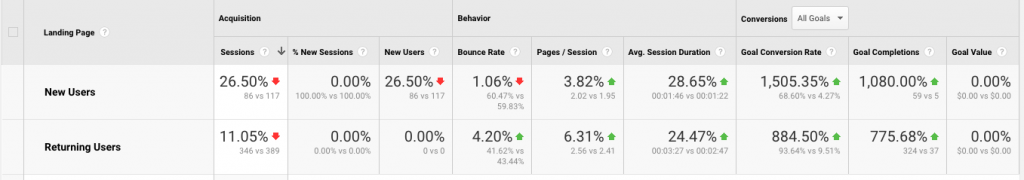
 But when we compare these reports over time (I’d recommend month-over-month or quarterly), it really starts to paint a picture. Now we see that our total sessions may have dropped, but our overall engagement and goal conversion rate has sky-rocketed. These are the types of insights that are worth sharing!
 How can your brand be more engaging online?
At the end of the day, the quality of your content is what’s most important. It needs to be glorious. The goal here is to be informative, entertaining, and highly consumable. For an actionable approach to creating great content, check out this Whiteboard Friday from our friends at Moz.
Drive Ongoing Customer Relationships with Subscriber Goals
Why it’s important: Overall email subscriber growth is one of the most impactful marketing metrics that we can measure. It not only indicates brand awareness and reach, but more importantly, engagement and loyalty. These beautiful people are raising their hands and inviting us into their precious inbox.
And in case you missed it – email continues to dominate all channels in ROI. Seriously. It’s not even close.
How can you grow an email list?
My best advice? Make this a priority and keep with it.
It takes time, but building an engaged subscriber list is a significant asset to the business. For some killer best practices, check out this post from Optimizely.
Customer Loyalty - Final Thoughts:
Marketing has evolved past the point of just generating demand. The content-fueled experiences we create have a profound impact on the overall brand loyalty of a customer.
As marketers, let’s challenge ourselves to be better at illustrating the value we bring to the business. When we hear “marketing metric,” let’s look beyond customer acquisition.
Let’s prove the long-term value that a loyal brand following brings to the business. If we can’t? The marketing team will never be recognized as the strategic, value-drivers that we are. That means less budget, smaller teams, and no seat at the “strategy table” when it comes to making (or failing to make) innovative decisions.
Are there any reports that you feel we missed? I’d love to hear from you in the comments below. And if you liked this post, feel free to hit the ‘ol subscribe button. We’ll send fresh ideas directly to your inbox.


Join the Discussion